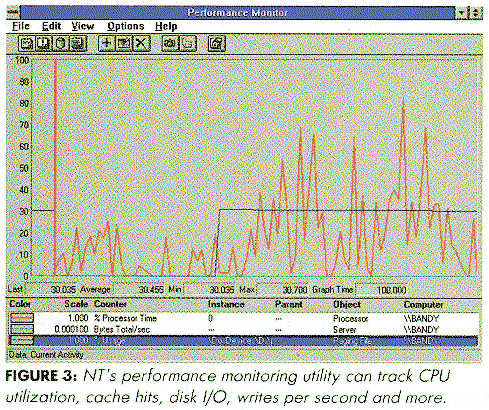
Labels:text | screenshot | display | line | parallel | diagram | rectangle | number OCR: Performance Monitor File Edit View Options Help 80 70 50 40 10 0 30.035 Average 30.455 Min 30.035 Max! 30.700 Graph Time 100.000 Scale Counter Instance Parent Computer 1.000 % Processot Time Processor MIBANDY 0. 000100 Sytes Total'scc Serve ABANDY KBANBY Data Current Achty FIGURE 3: NT's performance monitoring utility can track CPU utilization, cache hits, disk I/O, writes per second and more.